
Uninterrupted high throughput mechanobiology studies on 3D in vitro models
by Optics11 Life
© 2024 Optics11 Life B.V.
The mechanical properties of cells and tissues have gained attention for their importance in physiology and pathology. However, there are obstacles to transferring the growing bulk of mechanobiological knowledge from 2D to the more current 3D models. By combining the ferrule-top nanoindentation technology of Pavone and the micro-structured culture surfaces of Sphericalplate 5D® (SP5D, Kugelmeiers Ltd.), we measured the mechanics of hundreds of uniformly sized prostate cancer spheroids in their original culture plate. Additionally, we reproduced in 3D settings the changes in mechanical properties induced in 2D culture by cytoskeletal-targeting compounds. Taking full advantage of the multiparametric nature of the acquired data, we also utilized topographical information to derive a metric of the sphericity of our samples. The simple and semi-automated workflow characterizes hundreds of spheroids in a few hours with minimal user involvement. This integrated and multi-physic assay overcomes potential sample damage and advances mechanical readouts in 3D biology applications.
Introduction
3D cellular models are at the forefront of biomedical research for their ability to better recapitulate the behavior of native tissue1,2. However, the characterization of their phenotypical traits is often restricted by technical limitations. The analysis of the mechanics of 3D cultures has proven particularly challenging due to accessibility constraints and a lack of standardized assays3,4. This constitutes a substantial barrier to the exploitation of 3D models in mechanobiological research, limiting their impact on fields such as tissue regeneration, fibrosis, and cancer.
Typically, spheroids are manufactured using U-bottom, non-adhesive tissue culture plates or methods such as hanging drop or liquid overlay5. Regardless of the method, current approaches are relatively low throughput, require a considerable amount of work to be set up, and are incompatible with mechanical testing unless sample transfer and laborious preparations are involved6,7. For this reason, literature focused on the mechanics of spheroids, while showing extremely interesting results6,7,8,9,10, is currently held back by limited sample sizes (most of the cited studies analyze around 10 spheroids), especially when compared to equivalent studies conducted on 2D cultures11.
Recent developments in cultureware, such as Sphericalplate 5D® (SP5D, Kugelmeiers Ltd.), address such limitations through a design that maximizes accessibility and affords an elevated sample size for subsequent analysis. Critically, SP5D supports the streamlined generation of spheroids homogeneous in size and shape, optimizing standardization and reproducibility. Due to its ferrule-top probes, Pavone can be used with this culture solution, making it possible to conduct mechanical screening in the culturing vessel.
In this application note, we exploit the throughput power of Pavone for automated high-content acquisition of mechanical, imaging, and geometrical data on a large number of prostate cancer spheroids. This setup provides a method to culture, treat, and mechanically characterize spheroids in one uninterrupted workflow, bypassing the need for sample transfer and potentially damaging manipulation.
Results
Mechanical characterization of 3D cell culture systems is often cumbersome and time-consuming due to technical limitations dictated by the poor automatization of current methods. Adding to the challenges of performing such measurements, standardly used growth supports can restrict access to the sample, requiring the transfer of spheroids prior to their measurement and, often, designing a system of immobilization to prevent their undesired movement upon indentation12,13.
We circumvented these restrictions by culturing prostate cancer spheroids in SP5D. Owing to their geometry and surface (Fig. 1), SP5Ds gently encase the spheroids, thus containing their movement. By selecting a region of interest spanning a large portion of a spheroid, we mapped the distribution of Young’s modulus values in space (Fig. 2).
To characterize the elastic properties of multiple spheroids, we planned an automated array of one indentation point on each spheroid. In our experiment, the choice of tip radius and indentation depth results in an elastically deformed volume that encompasses multiple cells. With a user engagement of just a few minutes, we automated the probing of more than 50 spheroids and acquired the desired data in less than 30 minutes. Such a rapid manual method of point selection is deemed to return variable results, partly due to the different relative positions of indentation on each spheroid.
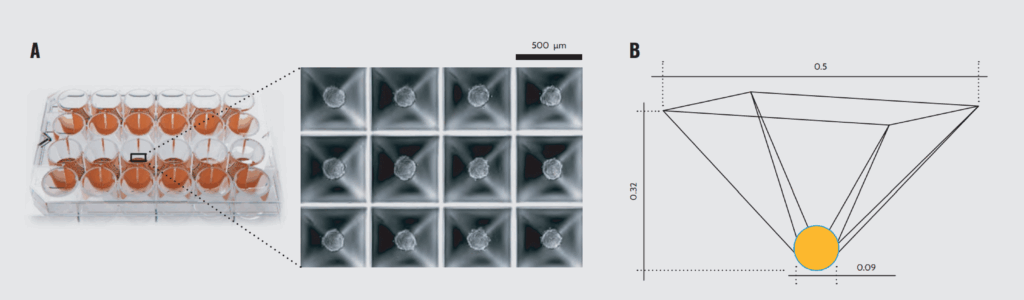
SP5D geometry. (A) 24-well SP5D with 12 functional wells. (B) Schematic model of a microwell. Dimensions are in millimeters.
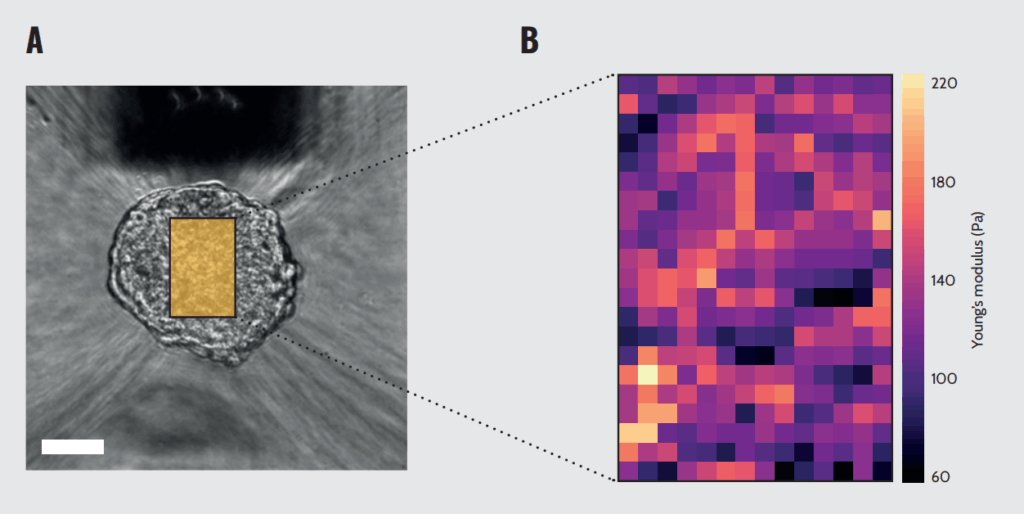
Mapping of the mechanical properties of a spheroid. (A) Representative picture of a prostate cancer spheroid grown on SP5D being approached by a ferrule-top indentation probe. The yellow rectangle depicts the surface probed for mechanical mapping. Scale bar = 50µm. (B) Heatmap of Young’s modulus values measured across the surface of the spheroid.
We observed a remarkable similarity in the distribution of Young’s modulus values when comparing those obtained by manually selecting points of single indentations with those returned by mapping large portions of the spheroid’s surface (Fig. 3). This result suggests that the high number of acquisitions compensates for the potential imprecision of manual selection, returning reliable mechanical measurements. The similarity of the distributions is also a testament to the consistency of the manufacturing method10.
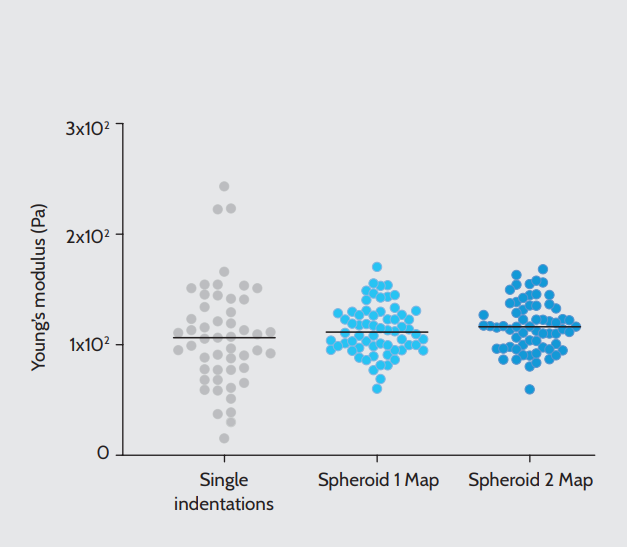
Young’s modulus values acquired by manually selected single indentations on different spheroids (left, N = 51) or by mapping a large portion of two representative spheroids at 10 µm intervals in X and Y (center and right, for each N of indentations = 64). Black lines represent median values.
We used automated single indentation to test the effect of well-known cytoskeleton-targeting compounds on the stiffness of prostate cancer spheroids. To this end, we treated the spheroids with Latrunculin B, which binds to monomeric actin, promoting cytoskeleton depolymerization14. As anticipated, depolymerization of the cytoskeleton resulted in decreased stiffness (Fig. 4, left). To induce an opposite change in mechanical properties, we treated spheroids with ethanol, which at the used concentration interferes with microtubular dynamics, inducing cellular stiffening13. At 2 hours of treatment, we detected an increase in Young’s modulus, which was even more pronounced when the measurement was repeated on a subset of spheroids after 6 hours of treatment (Fig. 4, right).
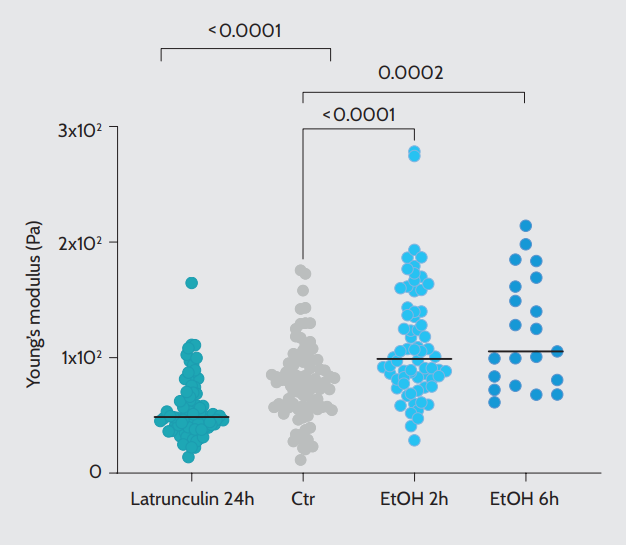
Young’s modulus values acquired by manually selected single indentation on spheroids treated with the indicated compounds. Control (Ctr) N = 85, Latrunculin-treated spheroids N = 74, and ethanol (EtOH)-treated spheroids for 2 or 6 hours N = 68 and N = 21, respectively. Black lines represent the median values.
The appraisal of the geometrical properties (such as size and circularity) of spheroids by microscopy is limited to those that can be obtained from very laborious and time-consuming projections derived from confocal microscopy data or from two-dimensional brightfield or fluorescent microscopy images. The inverted objective integrated into Pavone provides a way to collect these conventional images. However, for each indentation performed, Pavone collects the position of the contact point between the probe and the sample, besides the mechanical data derived from the measured load. This supplemental information enables the reconstruction of the topographical profile in Z of the free surface of the sample (Fig. 5A).
To broaden the scope of this analysis and derive a quantitative measure of sphericity, we developed an algorithm that fits the collected data to an ellipsoid (Fig. 5B). From that, we could derive an otherwise inaccessible true measure of sphericity, which factors in the three-dimensional geometry of the sample. Applying this metric, we could quantify the sphericity of prostate cancer spheroids on a scale from 0 to 1. The high values (Fig. 5C) and the narrow distribution indicate that the SP5D supports the growth of strikingly consistent spheroids, constituting a platform for generating large numbers of high-quality samples.
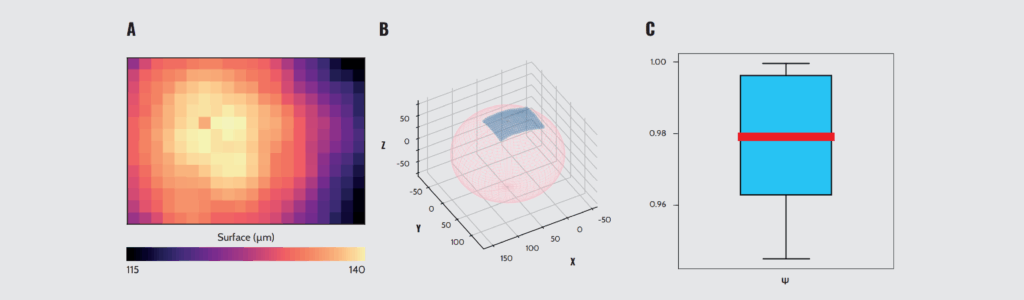
Quantification of the sphericity of spheroids. (A) Representative result of topographic characterization of a spheroid. (B) 3D representation of the spheroid topography (blue) and ellipsoid reconstruction (pink). (C) Boxplot with the sphericity (Ψ) calculation results for a subset of the measured spheroids (N = 6).
Conclusions
Pavone technology can be combined with SP5D to thoroughly characterize the mechanical properties of spheroids in a high throughput manner. Compared to the methodologies currently employed, this approach has the additional advantage of obviating any sample preparation requirements. This affords considerable time savings and, in addition, improves reliability, as it averts potential adulteration derived from sample transfer.
The ability to quantify spheroid shape beyond the projected diameter shows great potential for incorporation into a multi-physics characterization assay, for instance, in a drug development pipeline. Considering the sample size typically required by similar assays conducted on 2D cultures11, the approach described in this application note represents a significant step towards the widespread adoption of mechanical assays on 3D models.
Methods
Cell culture and spheroid formation
As a starting culture, we maintained C4-2 prostate cancer cells (ATCC) in RPMI medium (Gibco) supplemented with 10% FBS (Gibco) and 1X antibiotic–antimycotic solution (Sigma). We then generated spheroids by seeding 500 cells/microwell (for a total of 375,000 cells per well) in a 24-well SP5D, according to the protocol suggested by the manufacturer. Upon overnight incubation, we supplemented each well with 1 ml of additional medium. We performed all measurements 5 or 10 days post spheroid formation.
Nanoindentation assay
For the mechanical assay, we used a Pavone nanoindenter paired with a 0.0025 N/m and 23.5 µm R probe. We measured spheroids using either coordinate lists to indent every spheroid once or performed matrix scans. Single indentation coordinates on spheroids were selected manually from a stitched image of a vast area of the culture well. For matrix scans, we collected rectangular arrays of indentation curves around the spheroid apex, spacing them every 10 µm in both the X and Y axes. We modeled the curves using the Hertzian contact model. We then plotted the collected data as a heatmap of Young’s modulus values in space, obtaining a visual representation of the distribution of stiffness on the spheroid surface.
In both cases, the samples were indented using the Peak Load Poking mode. For the steady state experiment, we performed indentations with a load threshold of 10 nN and an indentation speed of 20 µm/s. For the drug treatment experiment, we chose a load threshold of 12 nN and an indentation speed of 10 µm/s.
Drug treatment and significance testing
We treated the spheroids with Latrunculin B (Enzo) at a final concentration of 0.5 µM for 24 hours or ethanol (Supelco) 50 mM for 2 or 6 hours. We tested the effect of the treatments on the elastic modulus by comparing them to the control group. For all tests, we used a Kolmogorov–Smirnov test executed in GraphPad Prism.
Spherricity assay
To quantify the out-of-plane curvature of the spheroids, we first extracted the topographical information from the contact fit of each matrix scan we collected. Then, we rigidly translated the matrix’s frame of reference so the ellipsoid fit would be centered at 0. To do so, we found the highest point in the matrix and associated that to (0, 0) in the XY plane. We then rescaled the Z axis so the highest point magnitude would be the side length of a matrix. Lastly, we fitted the point cloud to an ellipsoid in the form:
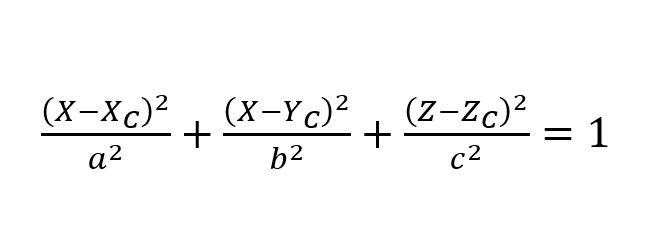
Where a,b,c are the ellipsoid semiaxes, and the subscripts refer to the center coordinates of the ellipsoid.
In every step, we assumed the vertical axis of the ellipsoid to have no tilt with respect to the axis along which
the probe approaches the sample.
We computed the sphericity ψ of spheroids as follows:
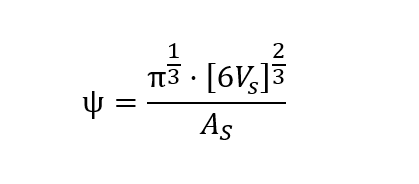
Where VS is the spheroid volume and AS is the spheroid surface. The former is calculated as follows:
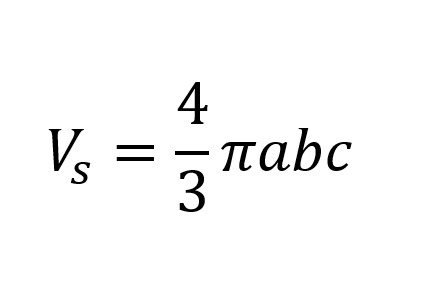
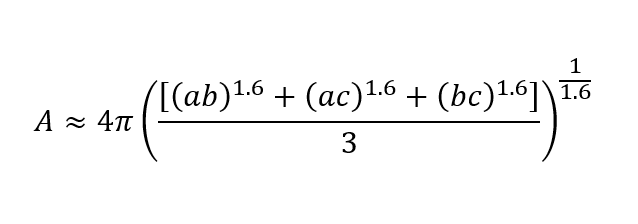
The surface is approximated as follows:
Acknowledgements
We thank Kugelmeiers Ltd., Zurich, Switzerland, for their support in providing the culture plates and critically reviewing this application note.
References
1 Habanjar, O., Diab-Assaf, M., Caldefie-Chezet, F., Delort, L. (2021). 3D cell culture systems: Tumor application, advantages, and disadvantages. International Journal of Molecular Sciences, 22(22), 12200. https://doi.org/10.3390/ijms222212200
2 Jensen, C., Teng, Y. (2020). Is it time to start transitioning from 2D to 3D cell culture? Frontiers in Molecular Biosciences, 7. https://doi.org/10.3389/fmolb.2020.00033
3 Murphy, R. J., Browning, A. P., Gunasingh, G., Haass, N. K., Simpson, M. J. (2022). Designing and interpreting 4D tumour spheroid experiments. Communications Biology, 5(1). https://doi.org/10.1038/s42003-022-03018-3
4 Fröhlich, E. (2020). Issues with cancer spheroid models in therapeutic drug screening. Current Pharmaceutical Design, 26(18), 2137–2148. https://doi.org/10.2174/1381612826666200218094200
5 Costa, E. C., Moreira, A. F., de Melo-Diogo, D., Gaspar, V. M., Carvalho, M. P., Correia, I. J. (2016). 3D tumor spheroids: An overview on the tools and techniques used for their analysis. Biotechnology Advances, 34(8), 1427–1441. https://doi.org/10.1016/j.biotechadv.2016.11.002
6 Gnanachandran, K., Kędracka-Krok, S., Pabijan, J., Lekka, M. (2022). Discriminating bladder cancer cells through rheological mechanomarkers at cell and spheroid levels. Journal of Biomechanics, 144, 111346. https://doi.org/10.1016/j.jbiomech.2022.111346
7 Jaiswal, D., Cowley, N., Bian, Z., Zheng, G., Claffey, K. P., & Hoshino, K. (2017). Stiffness analysis of 3D spheroids using microtweezers. PLoS ONE, 12(11). https://doi.org/10.1371/journal.pone.0188346
8 Kosheleva, N. V., Efremov, Y. M., Koteneva, P. I., Ilina, I. V., Zurina, I. M., Bikmulina, P. Y., Shpichka, A. I., & Timashev, P. S. (2022). Building a tissue: Mesenchymal and epithelial cell spheroids’ mechanical properties at micro- and nanoscale. Acta Biomaterialia. https://doi.org/10.1016/j.actbio.2022.09.051
9 Dolega, M. E., Delarue, M., Ingremeau, F., Prost, J., Delon, A., & Cappello, G. (2017). Cell-like pressure sensors reveal increase of mechanical stress towards the core of multicellular spheroids under compression. Nature Communications, 8. https://doi.org/10.1038/ncomms14056
10 Guillaume, L., Rigal, L., Fehrenbach, J., Severac, C., Ducommun, B., & Lobjois, V. (2019). Characterization of the physical properties of tumor-derived spheroids reveals critical insights for pre-clinical studies. Scientific Reports, 9(1). https://doi.org/10.1038/s41598-019-43090-0
11 Pérez-Domínguez, S., Kulkarni, S. G., Pabijan, J., Gnanachandran, K., Holuigue, H., Eroles, M., Lorenc, E., Berardi, M., Antonovaite, N., Marini, M. L., Lopez Alonso, J., Redonto-Morata, L., Dupres, V., Janel, S., Acharya, S., Otero, J., Navajas, D., Bielawski, K., Schillers, H., Lekka, M. (2023). Reliable, standardized measurements for cell mechanical properties. Nanoscale, 15(40), 16371–16380. https://doi.org/10.1039/d3nr02034g
12 Oriola, D., Marin-Riera, M., Anlaş, K., Gritti, N., Sanaki-Matsumiya, M., Aalderink, G., Ebisuya, M., Sharpe, J., & Trivedi, V. (2022). Arrested coalescence of multicellular aggregates. Soft Matter, 18(19), 3771–3780. https://doi.org/10.1039/d2sm00063f
13 Ryu, H., Park, Y., Luan, H., Dalgin, G., Jeffris, K., Yoon, H. J., Chung, T. S., Kim, J. U., Kwak, S. S., Lee, G., Jeong, H., Kim, J., Bai, W., Kim, J., Jung, Y. H., Tryba, A. K., Song, J. W., Huang, Y., Philipson, L. H., Finan, J. D., Rogers, J. A. (2021). Transparent, compliant 3D mesostructures for precise evaluation of mechanical characteristics of organoids. Advanced Materials, 33(25), e2100026. https://doi.org/10.1002/adma.202100026
14 Rigato, A., Miyagi, A., Scheuring, S., & Rico, F. (2017). High-frequency microrheology reveals cytoskeleton dynamics in living cells. Nature Physics, 13(8), 771–775. https://doi.org/10.1038/nphys4104
Key takeaways:
- Comprehensive Mechanical Characterization: Understand how our nanoindentation technology facilitates rapid, non-destructive mechanical characterization of prostate cancer spheroids, a crucial step for more effective drug screening and biological research using 3D in vitro models.
- Advanced Drug Response Analysis: Gain insights into how the mechanical properties of spheroids change in response to cytoskeletal-targeting compounds, enhancing the understanding of drug efficacy and cellular mechanics in 3D culture environments.
- Innovative Measurement Techniques: Explore our integrated approach that combines mechanical data with topographical mapping to assess the sphericity and other critical geometric traits of spheroids, offering a deeper level of analysis for 3D in vitro models.